Optimizing staff allocation to produce the greatest exposure to target demographic
For my first data science project I analyzed the MTA turnstile data that is provided on http://web.mta.info/developers/turnstile.html. We were given a hypothetical scenario where an organziation called WomenTechWomenYes (WTWY) is seeking advice to find interested individuals to participate in their gala and to raise awareness for their cause. This organization wanted to deploy their teams at the entrances of subway stations. These teams would then collect email addresses of people who were interested and send them free tickets to their gala. WTWY was having trouble deciding where to deploy their teams because of the enormous size of the MTA transit system. Therefore, my job was to explore the data available online to give them recommendations on how WTWY can optimize their limited resources.
My first assumption was that the street teams would have to greatest exposure at train stations where there is the highest traffic of people. However, the people of New York are known to be extremely diverse so I took the demographics around the train stations into account. Therefore, there are two parts of my analysis. One was to see the total traffic of people at each station and another was to analyze the demographics around each station.
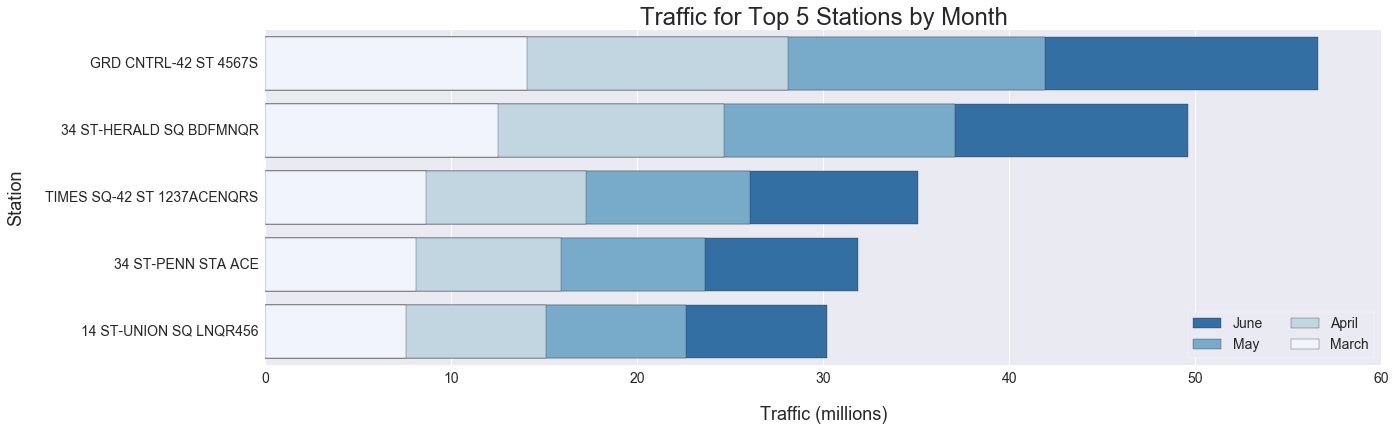
My group decided to collect all the data that was available on the MTA website which ranged from May 2010 to September 2016. However, we chose to focus on the months leading up to the gala which was in June so we decided to only look at March, April, May, and June of each year. The picture below shows a bar graph of the stations with the most traffic from March until June. Notice that these are the major train stations where commuters from the Greater New York area enter Manhattan.
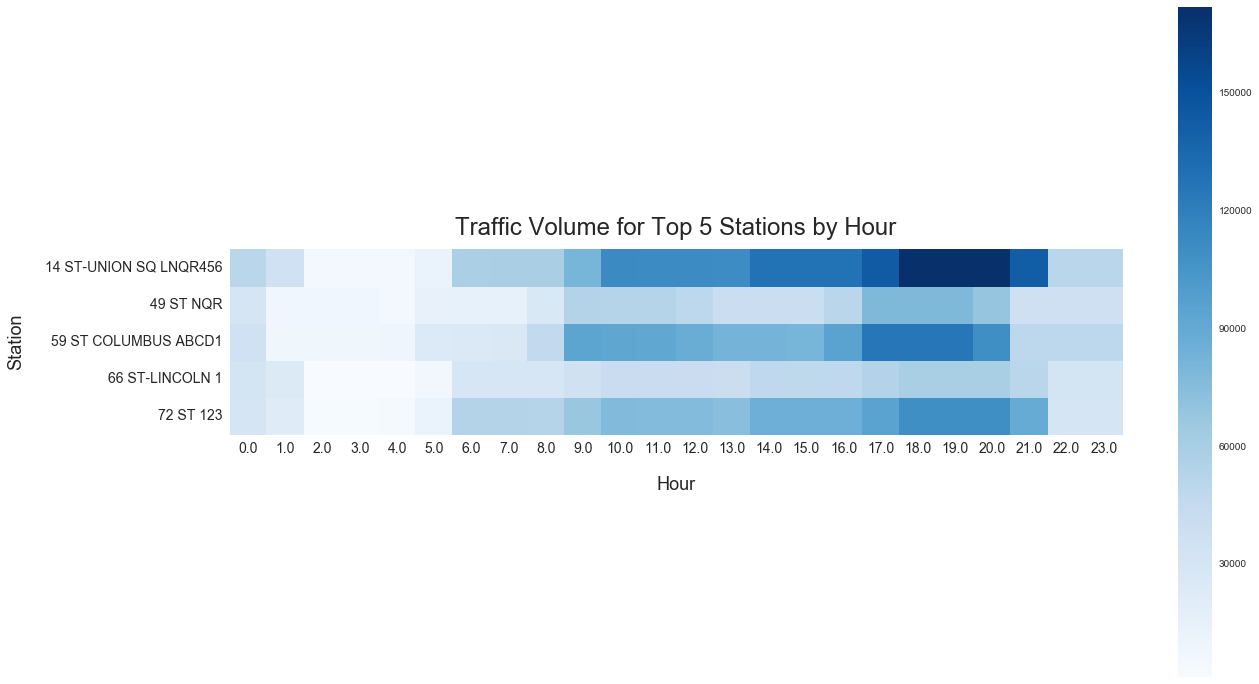
After finding this out we decided to figure out which hours of the day were the stations seeing the most traffic. My hypothesis was that these stations were busy during the commuting hours. The following graph confirmed my hypothesis.
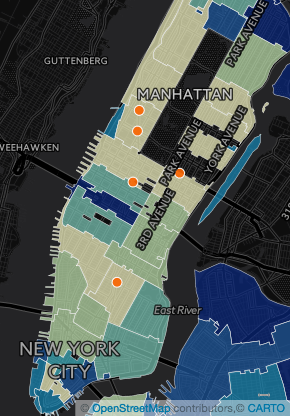
We looked at the demographics of NYC by zip code after finding out where and when the most traffic of people occured. We decided that the people that are most likely to be interested in attending the gala fall under the following categories: females, high income, and employees of the tech industry. We pulled data from the Census and OpenSecrets.org to see where there is a high concentration of people with these traits. The graph below shows the zip codes of people who are most likely to attend the gala with the clearest color being the highest concentration.
Finally, we were able conclude where to deploy WTWY’s staff. The 5 stations are 14th Street Union Square, 59th Street lines 456QNR, 72nd Street lines 123, 66th Street Lincoln Square, and 49th Street - 7th Ave. These recommendations were generated after taking traffic and demographics into consideration.